Options profit calculator — payoff at expiration, not a forecast.
A call, a put, a covered call or a vertical spread. Break-even, max profit, max loss, and the price where the trade stops being worth holding.
Debit: buy the lower strike, sell the higher one, pay the difference in premium. Maximum profit is capped at the width of the strikes.
Move the stock price to see the profit at expiration at that price.
What the payoff at expiration actually is
An option's payoff at expiration is the only part of its value that is arithmetic rather than opinion. Before expiry, an option trades at intrinsic value plus a time premium that depends on volatility, rates and days left; that time premium is what two market makers argue about. At expiration it collapses to zero, and what is left is exactly the intrinsic value against the strike. So this page computes intrinsic value minus the premium paid — or plus the premium received — for every stock price you might see on the expiration date.
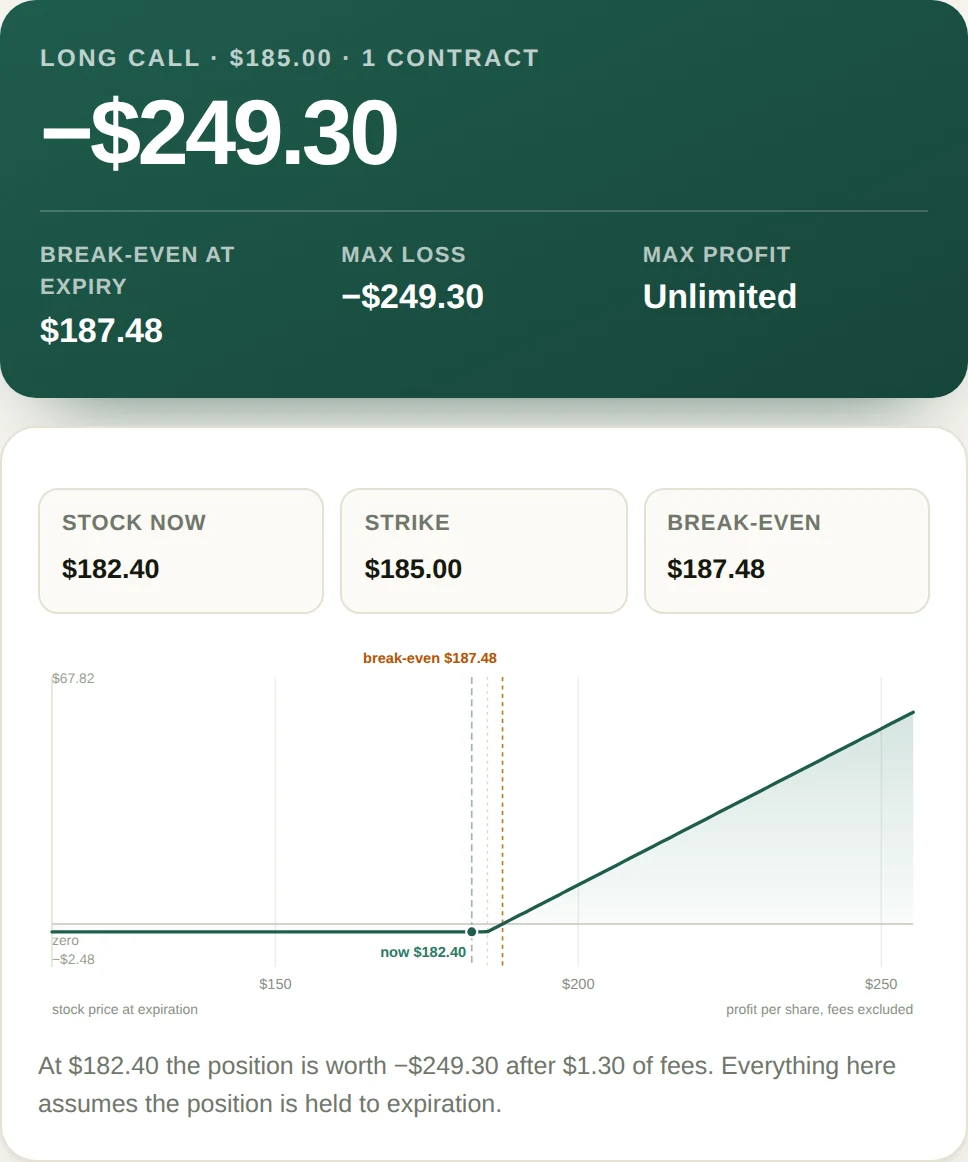
That sounds like a small thing, and it is the reason professional traders chart it before every position. A long call bought at $182.40 with a $185 strike for $2.48 looks like a "little more than 1% out of the money" trade. The chart says something more useful: the stock has to reach $187.48 before the trade makes a cent, which is 2.8% above today's price, and the premium is gone entirely below $185.
Reading the four positions
- Long call. You pay the premium and get the right to buy at the strike. Below the strike the option expires worthless and you lose the premium plus fees. Above it, each dollar of stock price is a dollar of intrinsic value per share. Break-even is strike plus premium: $185 + $2.48 = $187.48. With one contract the maximum loss is the $248 premium plus $1.30 of fees, and the upside has no ceiling.
- Long put. The mirror image. Break-even is strike minus premium: a $180 put bought for $3.10 breaks even at $176.90 and reaches its maximum profit of $1,690 per contract when the stock goes to zero. Below the strike, every dollar of decline is a dollar of intrinsic value.
- Covered call. You own 100 shares per contract and sell a call against them. The premium lowers your effective cost basis, and the call caps your gain at the strike. Buy at $168, sell the $185 call for $2.48, and the maximum profit is $185 − $168 + $2.48 = $19.48 per share, or $1,948 per contract, reached at any price at or above $185. The loss side is the stock going to zero, softened by $2.48.
- Vertical spread. Buying one strike and selling another of the same expiry turns an open-ended position into a fixed-risk box. Buy the $185 call, sell the $195 call, pay $4.10 net: the maximum loss is $410, the maximum profit is ($195 − $185) − $4.10 = $5.90 per share, or $590, and break-even is $189.10. The chart goes flat above $195 because both legs are then in the money by the same amount and cancel out.
Where the price stops being worth holding
Break-even is not the same as the price where holding stops paying. Every position has a point past which extra stock movement adds nothing, and that point is the short strike. On the covered call in the example, holding through a rally to $210 earns exactly what a rally to $185 earns; the $25 of upside belongs to whoever bought the call you sold. Knowing that before the trade turns an unpleasant surprise at expiration into a decision you made on purpose.
The same logic answers a question that catches most new option sellers: "my short call is 12 dollars in the money, should I roll it?" Rolling for a net credit keeps the trade alive but does not erase the loss — it converts a realized loss into a larger position with more capital at risk. The chart makes the trade-off visible, because the flat section on the right is precisely the part of the payoff you have already given away.
A worked example with real numbers
One $185 call on a stock trading at $182.40, paid $2.48, commission $0.65 each way plus $0.00 exercise, so $1.30 total. Contracts pay 100 shares each.
| Stock at expiry | Intrinsic value | Premium paid | Profit per share | On one contract |
|---|---|---|---|---|
| $175.00 | $0.00 | $2.48 | −$2.48 | −$249.30 |
| $185.00 | $0.00 | $2.48 | −$2.48 | −$249.30 |
| $187.48 | $2.48 | $2.48 | $0.00 | −$1.30 |
| $195.00 | $10.00 | $2.48 | +$7.52 | +$750.70 |
| $210.00 | $25.00 | $2.48 | +$22.52 | +$2,250.70 |
Two details in that table are worth more than the totals. First, the break-even row still shows a $1.30 loss, because fees are not free and a break-even that ignores them is optimistic by exactly that amount. Second, the loss is identical at $175 and at $185: the option is worthless at any price at or below the strike, so a 4% decline and a 1.4% decline cost the same. Anyone sizing a position from a "stop loss" on the stock rather than from the premium is lining up a loss that looks bigger than the chart.
Now put the same trade through a credit spread instead. Sell the $185 call for $2.48, buy the $195 call for $0.85, receive $1.63 net. Maximum profit is $163 at any price at or above $185, maximum loss is $1,000 − $163 = $837 if the stock finishes at or above $195, and break-even is $186.63. The probability of success is much higher than the long call's, the payoff when right is one fifth as large, and the loss when wrong is three times the credit. That asymmetry, not the direction of the trade, is what most option positions actually bet on.
Where these calculations go wrong
- Dividends and early exercise. A deep in-the-money American call on a stock going ex-dividend can be exercised early, which converts an open position into stock plus a tax event before expiry. The chart assumes expiration, so treat a dividend date inside the holding period as a separate risk.
- Assignment on the short leg. Short options can be assigned before expiry, and a covered call that gets assigned means the shares are sold — possibly triggering a capital gain you did not plan for. The payoff is the same; the tax is not.
- Contract size and odd lots. Each contract is 100 shares, so a 1,000-share position needs ten contracts to be covered. Nine contracts leave 100 shares uncovered, and that slice has unlimited risk that the chart will not show.
- Fees on exercise. Some brokers charge an assignment fee that appears nowhere in the premium. Two dollars here and there turns a clean break-even into a small loss, which matters on a 20-cent credit.
- Multiplier on index options. Broad-market index options are usually $100 per point but some are $10, and mini contracts exist. If the contract multiplier is not 100, the totals here are ten times too large.
Questions
Does this use Black-Scholes or a pricing model?
No, and deliberately not. Everything shown is the payoff at expiration, which is exact arithmetic: intrinsic value plus the premium you paid or received, times 100 per contract. A pricing model would add a guessed volatility and a guessed time to expiry, and those guesses are where calculators start disagreeing with each other.
How is a covered call different from a short call?
A short call on its own has unlimited loss above the strike, so the chart falls without a floor. A covered call is the same short call with 100 shares per contract behind it, so the downside is capped at the share price falling to zero. Enter the share cost under Covered call and the loss side becomes finite.
Why does the profit at the strike look wrong on a spread?
It is usually right and the assumption is wrong. On a debit spread the maximum profit is fixed at the long strike, not at the short strike, and the credit spread is the mirror image. The chart prints the flat section so you can see where the payoff stops changing.
Do commissions and assignment fees change the break-even?
Yes, by a small but real amount. Add per-contract commission and any assignment or exercise fee to the cost figure and the break-even moves out by that amount divided by 100 times the number of contracts. On one contract with $1.30 of fees, the break-even moves by 1.3 cents per share.
Can I price an option I already own in the middle of the trade?
Enter what the option is worth now as the premium and the answer becomes the profit from here to expiration at each price, assuming you hold. The premium you originally paid is history, not part of the decision, which is exactly why the sunk-cost instinct is so expensive on options.
Related calculators
Free, and it stays free
Options maths is arithmetic, so there is nothing to meter here. No login, no counter, no limit on how many positions you price.
- Every contract, every strike, every price — unlimited
- Nothing you type leaves this tab