Deductible break-even — where the cheap premium stops winning.
Four numbers per quote. The claim level where both plans cost the same, and which one wins on either side.
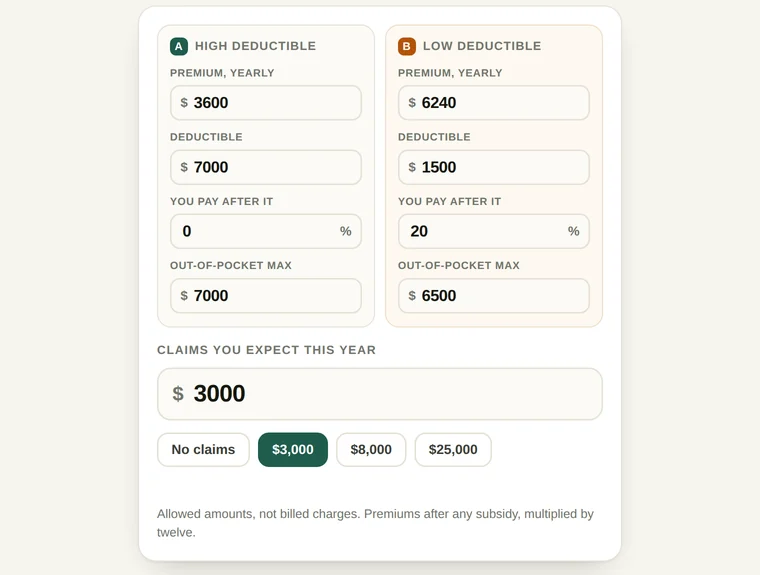
Allowed amounts, not billed charges. Premiums after any subsidy, multiplied by twelve.
What the break-even number answers
Two quotes arrive. One is $300 a month with a $7,000 deductible, the other $520 a month with a $1,500 deductible and 20% coinsurance after it. The premium gap is trivial to read: $220 a month, $2,640 a year, and it is the only figure either quote puts in bold. What neither quote tells you is how much care you would have to consume before the $2,640 you saved stops being enough.
Break-even is that claim level, the point where the two plans cost exactly the same in total: premiums paid plus everything that comes out of your pocket. Below it the low-premium plan is cheaper. Above it the low-deductible plan takes over — until one of the two hits its out-of-pocket maximum and stops accumulating cost, which is the part almost every comparison leaves out and the reason a cheap policy can win again in a catastrophic year.
How the two cost curves are built
Each plan is four numbers, and the arithmetic that turns them into a total is the same for both. Annual cost is the premium, plus the first dollars of claims up to the deductible, plus your share of everything above it, capped once your own spending reaches the out-of-pocket maximum. Written out for a claim level C:
- If C ≤ deductible: total = premium + C. You are paying the whole allowed amount yourself.
- If C > deductible: total = premium + deductible + coinsurance × (C − deductible), but never more than premium + out-of-pocket maximum.
So each curve is flat, then a slope of 1, then a shallower slope, then flat again at the cap. Two curves with three kinks each produce at most a handful of crossings, which is why the answer is a small set of thresholds rather than a single number you have to trust.
- Premium. Yearly, not monthly, and net of any marketplace subsidy. If your employer pays part of it, use only the part deducted from your pay — the employer contribution is not your money and does not change which plan is cheaper for you.
- Deductible. The in-network individual deductible. On a family policy, enter the individual figure when the comparison is for one person, and the family figure when it is for the household.
- Coinsurance. The percentage you pay after the deductible, not the percentage the insurer pays. 20 means 20, not 80. A plan with a 0% here is one that covers everything above the deductible.
- Out-of-pocket maximum. In-network, and it must include the deductible — the calculator raises it if you enter something lower, because a cap below the deductible is not a real plan.
A worked example: two plans that cross at $4,800
Plan A is the cheap one: $3,600 a year, $7,000 deductible, nothing to pay after it, $7,000 cap. Plan B is the richer one: $6,240 a year, $1,500 deductible, 20% coinsurance, $6,500 cap.
| Claims in the year | Plan A total | Plan B total | Cheaper |
|---|---|---|---|
| $0 | $3,600 | $6,240 | A by $2,640 |
| $2,000 | $5,600 | $7,840 | A by $2,240 |
| $4,800 | $8,400 | $8,400 | identical |
| $7,000 | $10,600 | $8,840 | B by $1,760 |
| $15,800 | $10,600 | $10,600 | identical |
| $30,000 | $10,600 | $12,740 | A by $2,140 |
The first crossing is at $4,800: A pays $3,600 plus the whole $4,800, B pays $6,240 plus $1,500 plus 20% of $3,300. Both land on $8,400. Somewhere between there and $7,000 the cheap plan stops being cheaper, and at $7,000 exactly — the point where A’s deductible and its cap are the same number — B is ahead by its maximum of $1,760. After that A is frozen at $10,600 forever, while B keeps paying 20 cents on every allowed dollar until it too caps, at $26,500 of claims and $12,740 of total cost.
That is why the second crossing at $15,800 exists, and why the honest summary of this pair is three bands, not one threshold: the cheap plan wins a quiet year, the rich plan wins the middle, and the cheap plan wins a catastrophe by $2,140. An insurance broker quoting the first number alone would be describing half the picture.
Where this arithmetic goes wrong
- Billed charges instead of allowed amounts. A hospital that bills $9,000 for a stay the insurer allows at $4,200 contributes $4,200 of claims. Enter the billed figure and you overstate spending, cross the break-even on paper, and buy cover you did not need.
- Family numbers for one person. Family deductibles are commonly double the individual one, and so are family caps. Using them while insuring one adult doubles the apparent cost of a bad year.
- Forgetting the reset. A deductible is per plan year, and the plan year is not always the calendar year. Surgery in December that clears this year’s deductible does nothing for January, and the new year starts at zero.
- Comparing sticker premiums. The subsidy is benchmarked to a silver plan, so it does not compress both quotes equally. The plan that looks $2,640 more expensive before the credit can be $900 more expensive after it, which moves the break-even by thousands of dollars.
- Ignoring copay layers. A plan with $30 office visits and a $40 generic tier never charges you the full allowed amount at low claim levels, so its real curve sits below the one built here. This model has no copay layer; if one plan has copays and the other does not, treat the break-even as an upper bound for the copay plan.
- Treating the break-even as a prediction. It is a threshold. Knowing you need $4,800 of care before the cheap plan loses does not tell you whether you will get there; it tells you how much of a gamble you are taking, which is a different and more useful fact.
The number to check before any of this
Add premium and out-of-pocket maximum for each plan. Here that is $10,600 against $12,740. That sum is the worst year each plan can produce, and it is the only figure that cannot be argued with, because nothing above the cap changes it. If one plan is cheaper at zero claims and cheaper at its cap, the middle band is a curiosity rather than a decision — you cannot lose by taking it, and the crossing points are only useful for knowing how much you would have won in an average year.
When the two sums are close, the middle band decides. Then the question becomes the one the calculator asks directly: what do you expect to spend? A household with a planned knee replacement, a pregnancy, or a standing specialist appointment has a claim level it can estimate within a thousand dollars, and at that level the answer is arithmetic rather than judgement. A healthy 29-year-old with no prescriptions is guessing, and guessing in the direction of the lower premium is usually right — but the $2,640 saved is worth banking, not spending, because an emergency department visit with a CT scan commonly lands between $2,000 and $6,000 of allowed charges and that is exactly the range where the cheap plan starts to lose.
One more adjustment worth making by hand: an HSA-eligible plan allows pre-tax contributions up to an annual IRS limit. Funding one near the limit at a 24% federal rate plus state tax is worth roughly $1,100 to $1,500 a year, which eats a large share of a premium gap this size. It only counts if you actually contribute, and unlike a premium it is money that stays yours.
Privacy
Nothing you type here is sent anywhere. There is no submit button, no analytics event carrying the numbers, and no server-side copy. Premiums, deductibles and a household’s expected medical spending are exactly the kind of thing that should not sit in someone’s log file, so the whole calculation runs in this tab and disappears when you close it.
Questions
Should I use the individual or the family deductible?
The one that matches who you are covering. On a family policy the deductible is usually close to twice the individual figure, and the out-of-pocket maximum is too, so entering the family number while insuring one adult overstates the cost of a bad year and pushes the break-even point higher than it really is. If you are choosing between an individual plan and a family plan, run the comparison twice, once per coverage type.
Do I count billed charges or the allowed amount?
The allowed amount, which is what the insurer and you together pay the provider. A specialist who bills $320 for a visit that the plan allows at $180 counts as $180 of claims. Using billed charges inflates the claim level for the same real care, and it makes a high-deductible plan look worse at low spending than it is.
Does the premium figure include a subsidy?
It has to, otherwise the comparison is between list prices nobody pays. The subsidy is tied to a benchmark silver plan, so it does not shrink both quotes by the same percentage: a bronze plan can end up cheaper than silver by far more than the sticker gap, or in some income bands by almost nothing. Put the net monthly figure from the marketplace after the credit in, multiplied by twelve.
Where does an HSA fit into this?
An HSA-eligible high-deductible plan lets you put money aside pre-tax, and the IRS caps the contribution each year. At a 24% federal rate plus state tax, funding the account close to the limit is worth roughly $1,100 to $1,500 a year in tax, which is a large part of a $2,640 premium gap. It is not automatic: the saving only exists if you actually contribute, and the money is yours to keep, which is a different thing from a lower premium.
What if I expect no medical claims at all?
Then the answer is the premium difference, and the calculator will say so: at zero claims the plan with the lower premium wins by exactly the gap between the two annual premiums. Be honest about the next twelve months though, because a single emergency department visit with imaging commonly lands between $2,000 and $6,000 in allowed charges, which is enough to cross a break-even in the low thousands.
My plan has $30 copays before the deductible. Can this model that?
Not precisely, and the page says so rather than pretending. A flat copay for office visits means the first few visits cost $30 instead of the full allowed amount, which lowers your cost at low claim levels and pushes the break-even point up, sometimes by a thousand dollars or more. If both plans have similar copays the error partly cancels; if only one does, treat the break-even as an upper bound for that plan.
Does this work for car or home insurance deductibles?
No. This models annual health cost sharing, where premiums are paid whether or not you claim and the deductible resets each plan year. On an auto or home policy the deductible applies per claim, so the comparison needs a claim frequency and a claims severity, not just one annual spend figure.
More money tools
Guides
No daily limit on this tool
This one is free with no counter — the arithmetic runs in your browser and costs nothing to serve. All-Access is for the PDF and document tools, which are free three runs a day.
- Unlimited PDF and document jobs
- Full-length output, no page cap
- Every tool added later, included